Wednesday, October 17, 2012
Investigating the Hiss Occurrence Rate as a function of IMF Clock Angle
Investigating the Hiss Occurrence Rate as a function of IMF Clock Angle:
We would like to explain a number of features of the hiss occurrence rate noticeable from the figures above. These six key features are listed as follows:
1. Prenoon hiss corresponds with negative IMF By. It is most apparent in the small to large negative Bz cases as seen from the IMF Clock Angle plot. This observation is also supported by the superposed epoch analysis.
2. Postnoon hiss is, instead, favored by positive IMF By and this is most apparent for small IMF Bz cases.
3. There are double peaks in the hiss occurrence rate on the nightside of the Earth as seen from the IMF Clock Angle figure (i.e. postnoon hiss is apparently separated from the premidnight hiss by a small minima at dusk)
4. A relatively wider Null at noon separates the prenoon hiss from the postnoon hiss
5. Premidnight hiss is associated with negative IMF By and also has a high correlation with the negative IMF Bz.
6. There are very few occurrences of the postmidnight hiss but the superposed epoch analysis show that these events are favored by positive IMF By.
Wednesday, October 10, 2012
Weimer05FAC, Wing10FAC & Null at Noon
FAC and Auroral Hiss Occurrence Rate:
Above figure shows the integrated, around SP geomagnetic latitude, Ionospheric FAC, taken from the Weimer05 model, for +90 and -90 deg. IMF Clock Angle, showing IMF By dependence, from morning to midnight magnetic local time. It also shows, in red, auroral hiss occurrence for the said IMF Clock angles.
Notes:
- As IMF By goes from -ve to +ve, we see that FAC in the post-noon sector become more negative / upward FAC increase, and we see a corresponding increase in the auroral hiss occurrence rate.
- We cannot explain from this figure the correlation of pre-midnight and pre-noon hiss on IMF By +ve. This is because upward currents increase in these two time sectors for IMF By -ve and Not for IMF By +ve.
Another important fact to note here about the Weimer 05 model is that, it shows dominating downward currents in the pre-noon sector for IMF By -ve at the South Pole latitude. This is in contrast to what Yan et al. (2012) point out from Wing et al. (2010) that at the South Pole latitude, we expect upward R2 FAC to dominate under the IMF By -ve conditions, as shown below:
First figure is for IMF By>0, which should logically correspond to IMF By<0 in the Southern hemisphere as Doyle et al. (1981) and others suggest about the conjugate FAC patterns.
Null at Noon in the Hiss Occurrence Rate:
I searched up that a list of authors (as discussed below) have shown evidence of and have tried to explain this gap in the occurrence of auroral phenomenon in the Southern Hemisphere:
1. Yan et al. (2012) say that "During a few hours around noon, the station is in the so-called throat
ow from dayside into the polar cap with little energetic electron precipitation."
2. Dandekar et al. (1978) say that "A gap in the midday sector of the auroral oval is examined on the basis of Defense Meteorological Satellite Program (DMSP) satellite auroral photographs"
3. Iijima and Potemra (1976) report a "confusion in the direction of the large-scale field-aligned currents
in the polar cusp region around 1130-1230 MLT during weakly disturbed conditions"
4. McDiarmid et al. (1976) note that electron spectra are harder in the postnoon (1400-1600 MLT) sector than in the prenoon (1000-1200 MLT) sector
5. Zaitzeva and Pudovkin (1976) show an existence of a midday auroral gap and hence a unique localized region of particle and field phenomena.
Thursday, October 4, 2012
Weimer05FAC_Radial-LinePlots_IMFClockAngle
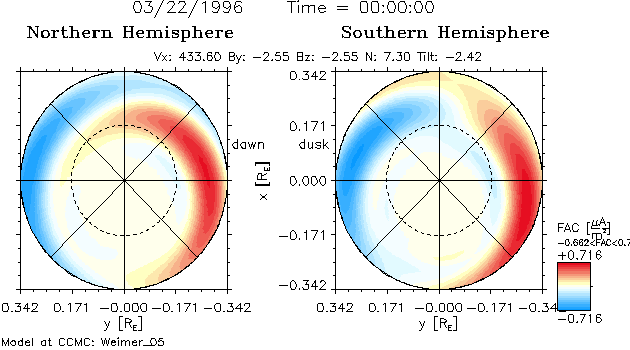
Below are the conjugate ionospheric field aligned currents (FAC) maps for -90 deg. and 90 deg. IMF Clock Angle respectively.
From these maps, we are particularly interested in explaining the increase in post-noon/pre-dusk SP auroral hiss occurrence rate for increasing By. -90deg. IMF Clock Angle plots (top one) corresponds to the -ve By and the bottom one, for +90deg IMF Clock Angle, corresponds to +ve By. Also note, that blue color represent the FAC coming out of the ionosphere (i.e. upwards and have -ve sign).
-90deg. IMF Clock Angle:
+90deg. IMF Clock Angle:
+90deg. IMF Clock Angle:
Note specifically that the FAC maps for the Southern Hemisphere, which show that for -ve By, upward FAC around SP latitude range increase as we move from Noon towards Dusk and then towards Midnight in MLT.
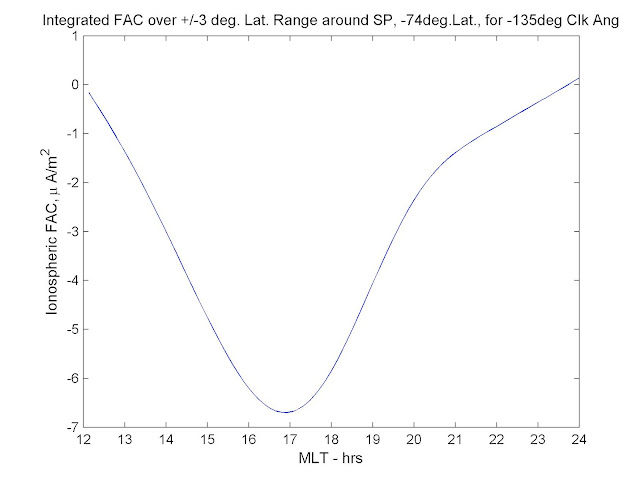
But of particular interest to us are the comparative magnitudes of these upwards FAC in the pre-dusk sector for -ve and +ve By conditions. For this reason we draw line plots of integrated FAC against MLT (Noon to Midnight), with FAC integrated over +/- 3deg. or 4 deg. around SP geomagnetic latitude of -74 deg.
Below are these Integrated FAC line plots:
-90deg. IMF Clock Angle:

Below are these Integrated FAC line plots:
-90deg. IMF Clock Angle:

This shows that the upward FAC do increase in the post-noon/pre-dusk sector for an increase in By (as the FAC are more negative). This might indicate that the downward electron precipitation increases with increased By in the pre-dusk sector hence resulting in a higher pre-dusk hiss occurrence rate associated with +ve By.
-135deg. IMF Clock Angle:
+135deg. IMF Clock Angle:
And Integrated FAC line plots are as follows:
Subscribe to:
Comments (Atom)


