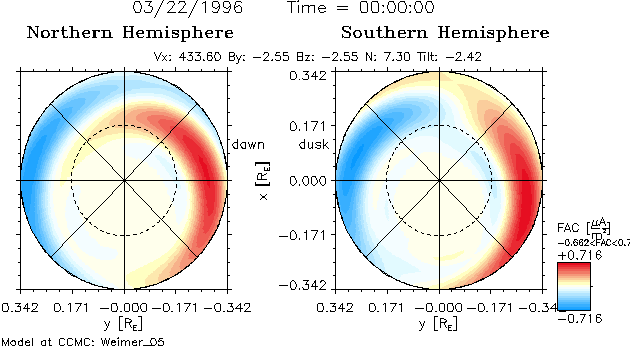
Below are the conjugate ionospheric field aligned currents (FAC) maps for -90 deg. and 90 deg. IMF Clock Angle respectively.
From these maps, we are particularly interested in explaining the increase in post-noon/pre-dusk SP auroral hiss occurrence rate for increasing By. -90deg. IMF Clock Angle plots (top one) corresponds to the -ve By and the bottom one, for +90deg IMF Clock Angle, corresponds to +ve By. Also note, that blue color represent the FAC coming out of the ionosphere (i.e. upwards and have -ve sign).
-90deg. IMF Clock Angle:
+90deg. IMF Clock Angle:
+90deg. IMF Clock Angle:
Note specifically that the FAC maps for the Southern Hemisphere, which show that for -ve By, upward FAC around SP latitude range increase as we move from Noon towards Dusk and then towards Midnight in MLT.
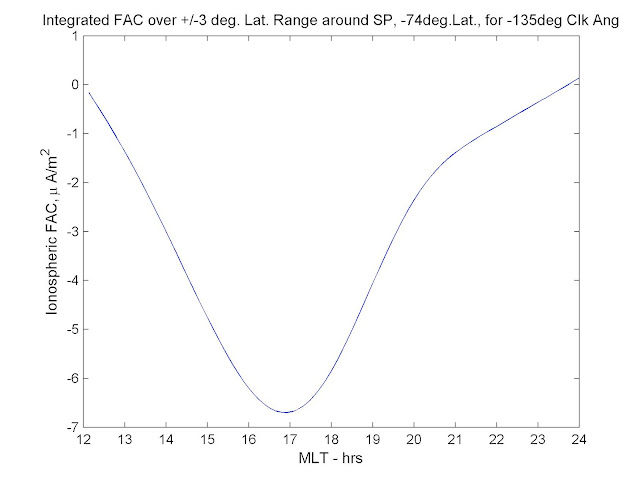
But of particular interest to us are the comparative magnitudes of these upwards FAC in the pre-dusk sector for -ve and +ve By conditions. For this reason we draw line plots of integrated FAC against MLT (Noon to Midnight), with FAC integrated over +/- 3deg. or 4 deg. around SP geomagnetic latitude of -74 deg.
Below are these Integrated FAC line plots:
-90deg. IMF Clock Angle:

Below are these Integrated FAC line plots:
-90deg. IMF Clock Angle:

This shows that the upward FAC do increase in the post-noon/pre-dusk sector for an increase in By (as the FAC are more negative). This might indicate that the downward electron precipitation increases with increased By in the pre-dusk sector hence resulting in a higher pre-dusk hiss occurrence rate associated with +ve By.
-135deg. IMF Clock Angle:
+135deg. IMF Clock Angle:
And Integrated FAC line plots are as follows:


No comments:
Post a Comment